Trajectory Model Configuration |
|||
 Previous |
 Next |
|
|
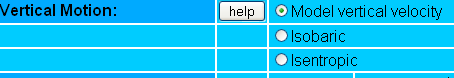
Vertical Motion Method
|
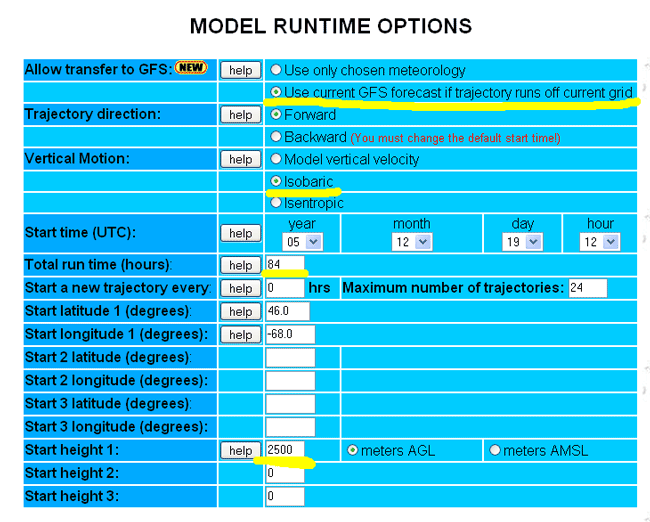
 The trajectory Model Runtime Option menu has several options
that control the computation. Some of them should be left at their
default values for most applications. For instance, computations should use the vertical
motion field (Model vertical velocity) contained within the
data file unless modeling the flow along constant pressure (isobaric) or constant theta
(isentropic) surfaces is needed. In the previous example, isobaric
was chosen to model the flow on the 700 hPa pressure surface. The model vertical motion
field is normally the better choice because the vertical motions come directly
from the meteorological model. More details on the vertical motion option will
be given later.
The trajectory Model Runtime Option menu has several options
that control the computation. Some of them should be left at their
default values for most applications. For instance, computations should use the vertical
motion field (Model vertical velocity) contained within the
data file unless modeling the flow along constant pressure (isobaric) or constant theta
(isentropic) surfaces is needed. In the previous example, isobaric
was chosen to model the flow on the 700 hPa pressure surface. The model vertical motion
field is normally the better choice because the vertical motions come directly
from the meteorological model. More details on the vertical motion option will
be given later.Meteorological Data File
 One key feature for any simulation is selecting
the best meteorological data file. In the current web version
only one meteorological data file may be selected per simulation
(HYSPLIT is compiled to run with up to 12 files). However, an
option is available in forecast mode to allow the model to switch to the
Global Forecast System (GFS) global data file automatically if the
trajectory runs off the chosen meteorological data set, either in time or
space. When multiple files are defined within HYSPLIT, at each integration
time step, the model finds the finest spatial resolution data set at the
location and time of the trajectory end-point.
One key feature for any simulation is selecting
the best meteorological data file. In the current web version
only one meteorological data file may be selected per simulation
(HYSPLIT is compiled to run with up to 12 files). However, an
option is available in forecast mode to allow the model to switch to the
Global Forecast System (GFS) global data file automatically if the
trajectory runs off the chosen meteorological data set, either in time or
space. When multiple files are defined within HYSPLIT, at each integration
time step, the model finds the finest spatial resolution data set at the
location and time of the trajectory end-point.
Direction
 Forward or backward trajectories can be calculated. When choosing backward trajectories
the starting time is the time the trajectory will arrive a the entered location. This time
will normally need to be changed because the default time given on the web form is the first
record in the meteorological data file. In forecast data sets if the starting time is not
changed from its default the backward trajectory will not run.
Forward or backward trajectories can be calculated. When choosing backward trajectories
the starting time is the time the trajectory will arrive a the entered location. This time
will normally need to be changed because the default time given on the web form is the first
record in the meteorological data file. In forecast data sets if the starting time is not
changed from its default the backward trajectory will not run.
Starting heights
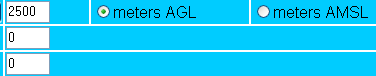 Another important consideration when starting a trajectory is the starting
height. The starting height can be defined as either meters above ground level
(MAGL) or meters above mean sea-level (AMSL). MAGL refers to the terrain as it is
defined in the meteorological model, not the actual terrain height. The higher the
resolution of the meteorological data, the better the terrain will be modeled. Since
the meteorological data is sampled from selected points on a grid, valleys and mountains
tend to get smoothed out. Therefore, when starting a trajectory at the top of a mountain
it's important to realize that the meteorological model might resolve the mountain at
only half the true height in some cases. If the height is entered as AMSL, HYSPLIT will
convert the height to MAGL during the calculation, as the model is run on a terrain-following
coordinate system. The web version allows up to three user-entered heights. More details
on the starting height and model terrain height will be given later.
Another important consideration when starting a trajectory is the starting
height. The starting height can be defined as either meters above ground level
(MAGL) or meters above mean sea-level (AMSL). MAGL refers to the terrain as it is
defined in the meteorological model, not the actual terrain height. The higher the
resolution of the meteorological data, the better the terrain will be modeled. Since
the meteorological data is sampled from selected points on a grid, valleys and mountains
tend to get smoothed out. Therefore, when starting a trajectory at the top of a mountain
it's important to realize that the meteorological model might resolve the mountain at
only half the true height in some cases. If the height is entered as AMSL, HYSPLIT will
convert the height to MAGL during the calculation, as the model is run on a terrain-following
coordinate system. The web version allows up to three user-entered heights. More details
on the starting height and model terrain height will be given later.
Display Options
Most of the options available in the Display Options section are self-explanatory. Settings in this section control how the final graphic will appear and provide additional output capabilities beyond a standard graphic. A few of the options will be discussed in later sections.
Example
For the next example see Example 2 Powerpoint (Ex2_hysplit.ppt)or,
select the following options:
- NAM 40 km
- source location: 46N, 68W(Maine)
- starting height: 2500 m
- vertical motion method: isobaric
- duration: 84 hrs
- vertical plot height unit: Pressure (from the Display Options menu)
- Use current GFS forecast if trajectory runs off current grid
Execution of the model for this case (CONTROL file) results in a trajectory that goes northeast using the NAM 40 km forecast file until running off the NAM domain where it then uses the GFS for the remainder of the calculation.
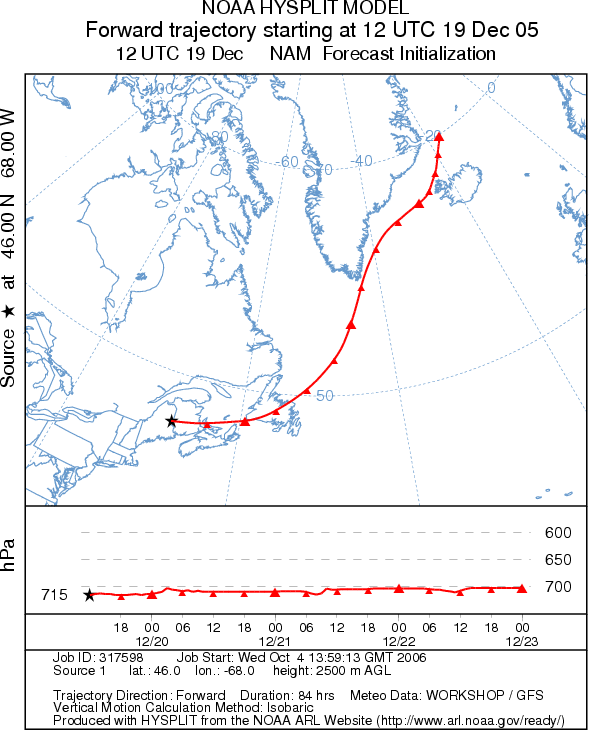
The meteorological file identifier is written with each end-point position in the second column of the ASCII trajectory endpoints output file, which can be viewed by clicking on the link on the model results page. The diagnostic MESSAGE file also provides additional detail about the calculation. In this example, the switch from NAM to GFS occurs after 0700 GMT on December 20, 2005, causing the 0600 and 0900 UTC data to be reloaded.
Previous |
Next |